Project Publication
Micah Y. Myers published a paper on the Mapping Cicero’s Letters project in the volume Teaching Classics in the Digital Age:
“Mapping Cicero’s Letters: Digital Visualisations in the Liberal Arts Classroom”
Micah Y. Myers published a paper on the Mapping Cicero’s Letters project in the volume Teaching Classics in the Digital Age:
“Mapping Cicero’s Letters: Digital Visualisations in the Liberal Arts Classroom”
Second International Classics Conference in Ghana. University of Ghana, Legon (December, 2022)
Cicero Digitalis: Cicero and Roman Thought in the Age of Digital Humanities. Remote Conference Sponsored by the Università del Piemonte Orientale (February, 2021)
Teaching Classics in the Digital Age (June, 2020): https://www.ancientcities.eu/teaching-classics-congress (A video of this presentation is available here: https://cloud.rz.uni-kiel.de/index.php/s/2jBoYTc39qm7PxW
SCS Annual Meeting (January, 2020): https://classicalstudies.org/annual-meeting/2020/151/preliminary-program-2020-annual-meeting
University of Pittsburgh (November, 2019): https://www.classics.pitt.edu/event/micah-myers-mapping-ancient-texts-digital-visualizations-classics-teaching-and-research
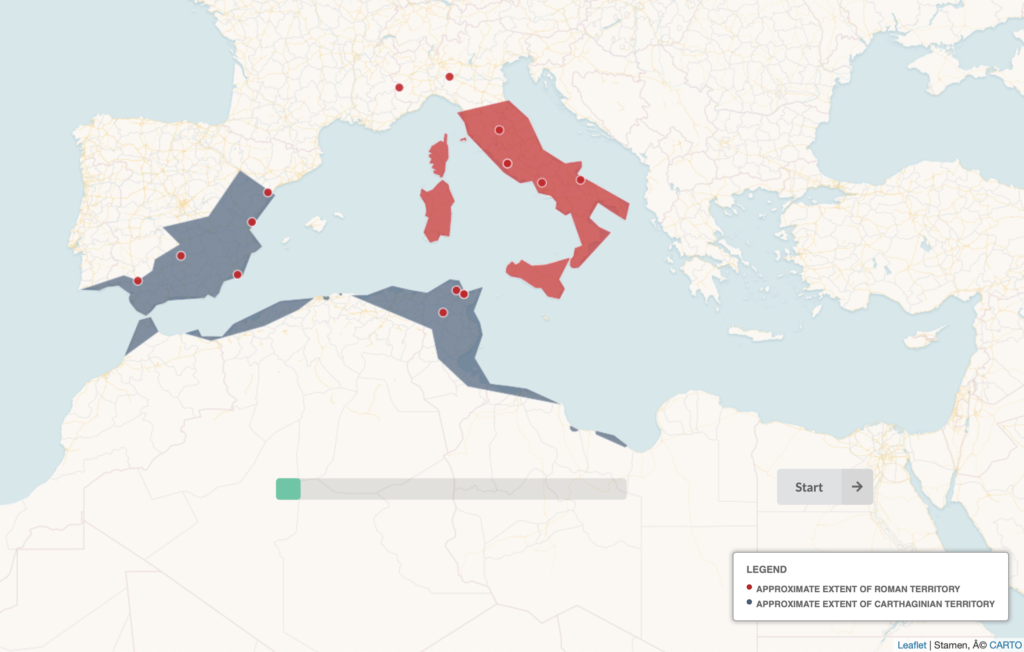
“Mapping Hannibal” represents a new type of digital visualization for the Mapping Ancient Texts project (MAT). MAT student-researcher Daniel Olivieri (Kenyon ‘19) won a 2018 Kenyon Summer Digital Scholarship award to develop the project. “Mapping Hannibal” is a geo-referenced digital visualization about the major events in the life of Hannibal Barca, with a particular focus on the Second Punic War. The final product maps Hannibal’s movements during his lifetime, following him from his childhood in Carthage to his years of leadership in Spain, through his momentous victories in Italy, and finishing with his defeat at the battle of Zama and eventual exile from Carthage.
Visualizing this sort of geo-referenced narrative presented new and exciting challenges for MAT. After researching Hannibal and the Second Punic War, Daniel used Leaflet to create info-boxes that are geo-referenced on a Carto map layer. The info-boxes contain a summary of the relevant events that occurred in a given location (e.g., a battle), as well as links to primary and secondary sources. Presented with the challenge of narrating a long and complex story succinctly, Daniel added a glossary that allows readers to learn more about different historical figures and events without leaving the website. The resulting glossary, made using modal boxes, features over twenty entries covering important individuals, groups, and major battles. The latter are visualized with GIFs created by Daniel that animate reconstructions of the conflicts.
Daniel used the Semantic UI library to establish an attractive and consistent style throughout the site. He used JSON objects to hold the data for each point and for each entry in the glossary. In order to show the approximate extent of Roman and Carthaginian territory, he used Carto’s polygon feature. Through a progress bar at the bottom of the map, the site gives users a sense of how far along they are in the narrative.
In its completed form, “Mapping Hannibal” makes a famous event in Roman history available in a novel way through a digital medium. “Mapping Hannibal” emphasizes space and place; incorporates maps as well as other types of visualization, especially GIFs; and relates the narrative in a manner that is approachable, but that also provides links to primary sources, such as Polybius and Livy, and fundamental secondary sources, like the Oxford Classical Dictionary. We hope that Mapping Hannibal will be of interest to students and enthusiasts at all levels as well as to others working on digital mapping and data visualization.
Micah Myers presented a paper co-authored with Joseph M. Murphy, titled “Teaching Roman Mobility: Digital Visualization in the Classroom and in Undergraduate Research” at the conference “Digital Cartography: New Maps, Ancient History” co-sponsored by the Ancient World Mapping Center, University of North Carolina, Chapel Hill, and Duke University’s Departments of Classical Studies and of Art, Art History & Visual Studies. Below is an abstract for the paper.
Teaching Roman Mobility:
Digital Visualization in the Classroom and in Undergraduate Research
Micah Myers & Joseph M. Murphy (Kenyon College)
This paper looks at pedagogical applications of our web-based digital visualization project, Mapping Ancient Texts (MAT). We discuss: (1) a course in which students use the web application Carto to create visualizations from geo-spatial information in Cicero’s Letters; and (2) a student-researcher developing a digital visualization of Hannibal’s movements during the Second Punic War. This paper explores how these projects teach important technical skills and engage students in detailed analysis of Roman mobility and history. We also discuss the challenges of using evolving technologies in the liberal arts setting.
The “Mapping Cicero’s Letters” project approaches epistles as travel texts, in so far as they move from author to addressee and frequently make reference to the journeys that Cicero and his correspondents undertook. The data for “Mapping Cicero’s Letters” was created by Kenyon students enrolled in “The Ends of the Earth in the Ancient Imagination” in 2016 and 2018. The project was taught collaboratively by Assistant Professor of Classics, Micah Myers; director of the Kenyon College Center for Innovative Pedagogy, Joseph M. Murphy; and, in 2016, a student-researcher. Students, working in pairs, created their own digital visualizations as well as contributing to a collective dataset. To make visualizations, students learned to use the web application Carto, to analyze Cicero’s letters for information related to travel and geography, to find geographical coordinates using the Pleiades gazetteer, to create properly formatted tabular data, and to use SQL and CSS to manipulate their data and style their visualization. Students also wrote brief reports and gave presentations of their work.
All the groups succeeded in creating visualizations, although they faced challenges. In particular, students’ baseline experience with technology varied greatly, and Carto, like many apps, has bugs that occasionally present issues. Moreover, Carto released a new version of its application between the first and second iterations of the project, which required the instructors to learn new methods and adapt instruction. These challenges, however, encouraged students and instructors alike to develop resiliency, troubleshoot problems, and refine their work until the visualizations were completed.
In addition to bringing digital visualizations into the classroom, Myers also is advising a student, already contributing to the research side of MAT, as he develops his own related project, “Mapping Hannibal”, a geo-spatial narrative based on the Second Punic War, funded by a Kenyon Digital Summer Scholarship. “Mapping Hannibal” uses Carto, Leaflet, JSON Objects, and GIFs to visualize Hannibal’s movements around the Mediterranean. It employs digital technology to make Hannibal accessible in a new medium to college and advanced high school students. The project is an example of the exciting innovations that an engaged student with technical skills can bring to digital visualization. It also demonstrates some of the challenges of undergraduate research that involves proficiency in both classics and technology.
The paper concludes by discussing possible future pedagogical applications of digital visualization in the classics classroom.
Thanks to the efforts of Daniel Olivieri, the MAT Interface now offers dynamic filtering. This feature allows the user to filter the visualization within and across the menu categories. For instance, one can sort the visualization of our Cassiope travel narratives to show only travel by sea in texts categorized under the genres “letter” and “biography”. A full-screen version of the dynamic filtering version of the interface can be accessed here: cassiope28March.
The “Mapping Cicero’s Letters to Atticus” project approaches epistles as travel texts, in so far as they moved from author to addressee. The data for “Mapping Cicero’s Letters to Atticus” was created by Kenyon students enrolled in CLAS 225: The Ends of the Earth in the Ancient Imagination in spring 2016. The students, working in teams of two, not only created their own data, but also visualized the data in Carto. Collectively, the students created a data set that represents Letters to Atticus 20-114 and 118-132 (Shackleton Bailey). This data set covers nearly all of the Letters to Atticus from May 60 – December 50 BCE.
Whereas MAT’s prototype visualized travel narratives that described journeys which passed through Cassiope, Mapping Cicero’s Letters to Atticus visualizes the journeys that the letters themselves may have taken when they were sent from Cicero to Atticus. The visualizations rely on information in the headers to Cicero’s Letters as well as evidence from the texts themselves. As such the visualizations may best be understood as reflecting travel represented by the the manuscripts through which the letters were transmitted rather than the actual movement from author to addressee.
This project yielded a variety of visualizations. Below are some examples
The first visualization shows all the letters in the data set. Information about each letter may be accessed by hovering and clicking over points and arcs.
The second visualization demonstrates the frequency that a place name is mentioned in the data set using Carto’s cluster layer wizard.
A third visualization uses Carto’s torque feature to visualize where Cicero was when he each letter during the 50s BCE.
Each student group was tasked with creating data and a visualization for a smaller set of letters. Below are two examples. In the first one Ashley Zillian and Jackson Todd have experimented with labels and colors to visualize Letters 100-114. N.B. The caption to the legend (404-429) refers to location IDs assigned to each place in the data set.
A second example, by Sean Deryck and Kate Zibas, uses color coded points to represent the locations of Cicero (blue points) and Atticus (red points). In addition, color coded arcs represent the place from which the letter was sent.
This is the current version of the visualization platform, using data representing all travel narratives that mention Cassiope. A similar version of the platform was presented at the Kenyon College Celebration of High Impact Practices on March 31, 2016.
Open this visualization in full screen.
About the Cassiope Visualization
This prototype visualizes every classical travel narrative that mentions Cassiope, a port on the island of Corcyra (modern Corfu). Each travel narrative is represented as a series of points and journey segments representing the travel between those two points. The prototype allows users to read entire narratives by clicking on the points and journey segments as well as to compare narratives to one another. When more than one narrative refers to the same place, zoom in to see all the individual points. Users are also able to filter the data in several ways using the menu buttons.
For the purposes of the project we define a travel narrative as a textual passage that describes or implies a journey between at least two discrete points. A travel narrative may comprise an entire text, a section of a text, or may stretch over several shorter texts. For the prototype we only consider travel between communities rather than intra-community travel. In the case of Cassiope, we found eight travel narratives that mention the port. These narratives describe travel through fifty-seven total places as far west as Rome and as far east as Corinth. In the case of Cicero and Galen, however, the travel narratives we visualized are in fact one section of larger journeys between Rome and Asia Minor.
Analysis
The visualization reflects Cassiope’s links to the travel networks connecting Italy and Greece, a role which is also attested in the archaeological record (see Zernioti 2007). The frequency with which certain points are mentioned is also notable. Naturally, Cassiope appears most often. Further, as might to be expected, since Cassiope is on the route between Italy and the eastern Mediterranean, the second most frequently mentioned place is Brundisium. The third most commonly mentioned place, Rome, is less expected, given it is not proximate to Cassiope. All of the narratives, whether in Latin or Greek, were written in a Roman context between 50 BCE and the 6th century CE, which may explain the frequent references to Rome. In one sense, the visualization reinforces the the notion that all roads lead to Rome.
If we set aside the two latest sources, the Itinerarium Maritimum and Justinian, some other patterns emerge. In three of the remaining six narratives (Cicero, Gellius, and Epictetus) bad weather is involved. In two others (Suetonius and Galen) the travel to Cassiope is linked with hurrying: Galen is rushing to get out of Italy; Nero, in the thrall of philhellenism, is rushing to get to the Greek world; Cassiope provides the earliest opportunity to visit a Greek polis on his trip. Only Strabo, who describes not a specific journey, but rather reports more general information of the sort that might be found in itineraria, mentions neither bad weather nor a hurried traveler (the Itinerarium Maritimum and Justinian passages likewise describe general rather than specific travel).
Work Cited
Zernioti, D. 2007. ‘A Burial Complex in the Roman City of Cassiope in North East Corfu—Some Remarks,’ in A. Faber et al. (eds.), Körpergräber des 1.— 3. Jahrhunderts in der römischen Welt. Frankfurt: 121-9.
In April 2016, Micah Myers gave a talk on Mapping Ancient Texts and the Cassiope visualization prototype at the conference Mapping the Past: GIS Approaches to Ancient History hosted by the Ancient World Mapping Center at the University of North Carolina.
All of the talks from the conference are available on YouTube. Number six on the playlist is Myers’ Mapping Ancient Texts presentation.
This visualization complements the Cassiope visualization above. The timeline allows the data to be filtered by the date which the travel narratives where composed.